Getting Started with DAGraph
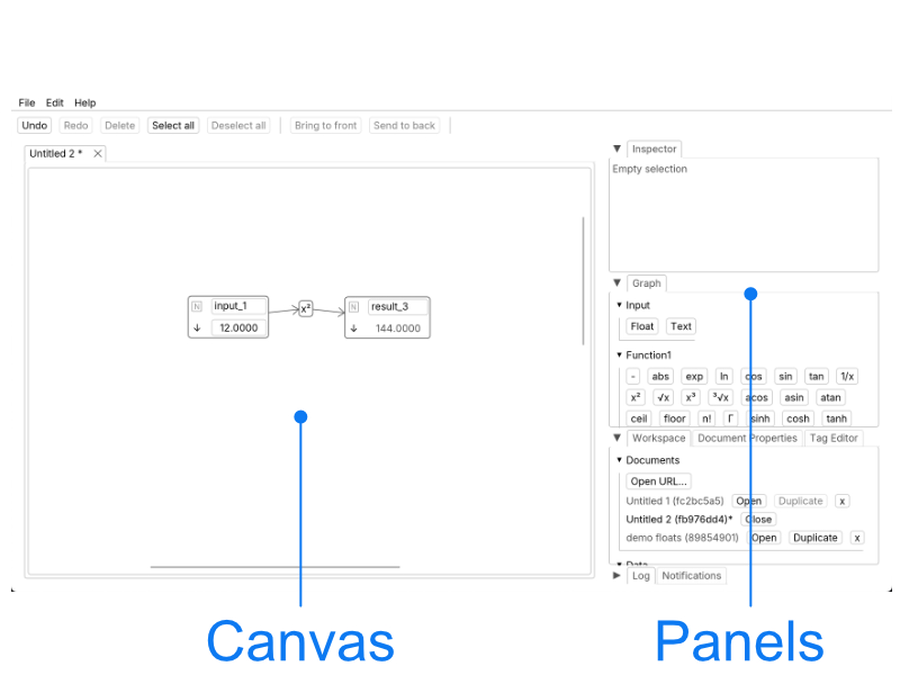
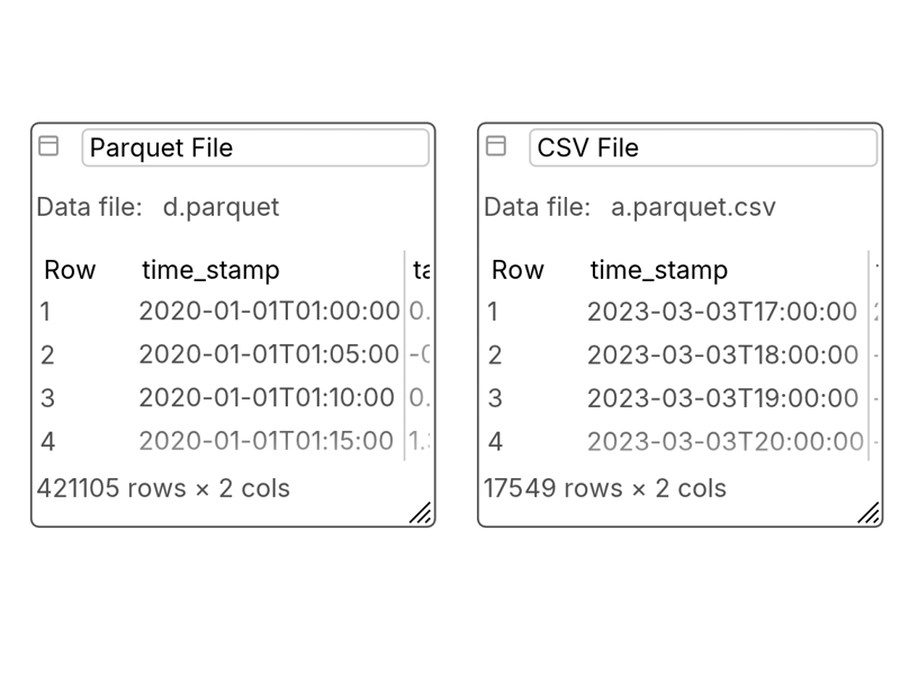
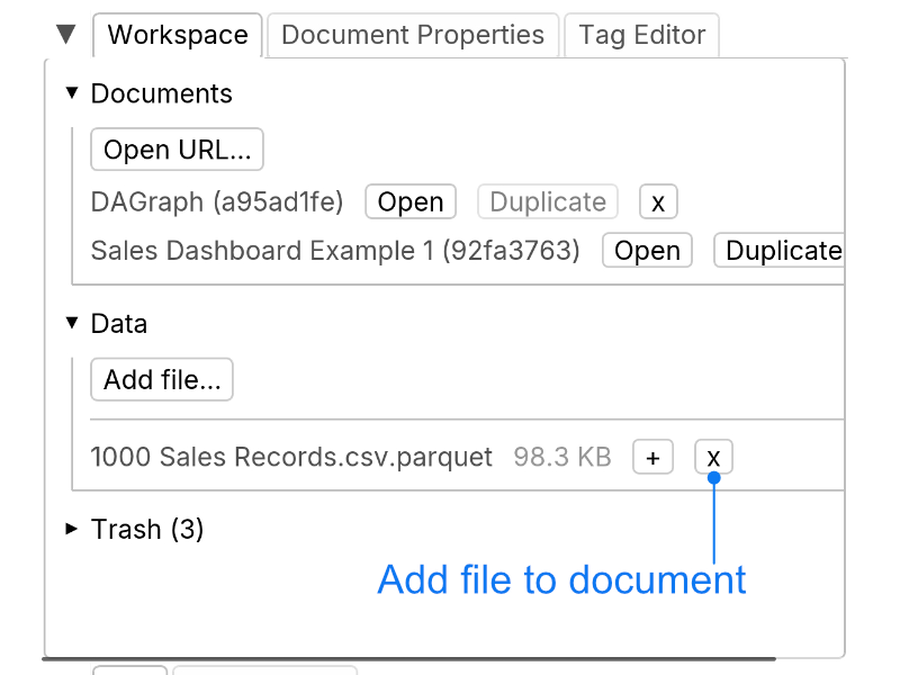
This is a very short tutorial to get you started. This step-by-step tutorial will walk you through the basics of DAGraph: creating nodes, connecting them, writing SQL, and importing data. Go to DAGraph. No account needed - the app runs entirely in your browser. You will see an empty canvas on the left and panels on the right: the Inspector, the Graph panel (with node creation buttons), and the Documents panel. In the right panel, under Input, click Float to create a numeric input node. A new node appears on the canvas. Click on the node's value field and type a number (e.g. Make sure the node in the canvas is selected. In the right panel, under Function1, click + (addition). A function node appears on the canvas. If you clicked on addition, this function requires 2 inputs, one input is the node you selected, the other is a newly created node. If no nodes were selected, the function would have created 2 nodes. Change the value of one of your input nodes. The result updates instantly - this is the reactive graph in action. Every downstream node recomputes automatically when its inputs change. In the right panel, under Table, click New table. An editable table node appears on the canvas. Use +Row and +Col to add rows and columns. Click on cells to enter data. You can set column names and types (Utf8, Int64, Float64, etc.). In the right panel, under Table, click New SQL. A SQL node appears on the canvas. Write a query that references your input table by its label. For example, if your table is named "Input table": Click Save to run the query. A result table appears next to the SQL node, and DAGraph automatically draws a dependency link to the input table. You can import parquet files and CSV files. To add a file, click on Graph -> Table -> "Table From File". The browser will ask you to choose a file, pick a parquet or CSV file. Once chosen, the a table should appear in the document showing the data. The file is loaded into the browser's local storage (OPFS), it is not uploaded anywhere. You can then reference the new table in SQL queries just like any other table. If you add a file in the workspace (Workspace -> Data -> Add File), the file will be load in the workspace but not added to the document. A data file can be added to multiple documents with the "+" button next to the data file name. Experiment. Check out the documentationOpen DAGraph
Create your first input nodes
10). You can also r ename it by clicking on its label.Add a math function
Create an input table
Write your first SQL query
SELECT name, age
FROM "Input table"
WHERE age > 25
Import a file as a table
Next steps
Ready to try?