Introduction
DAGraph is a Data Analytics Graph or a Directed Acyclic Graph.
Caveat
As of the time of writing this book, DAGraph is still evolving quickly and still in early-access.
Some features may change, or be removed. Some features may move to the PRO tier (paid).
DAG - Directed Acyclic Graph
Directed acyclic graph. The data flows from the input to the output, there are no cycles.
The app will prevent you from creating cycles.
General UI overview
The window is split in 4 main parts:
- the menu (top bar)
- the tool bar (below the menu)
- the document / canvas view
- the panels
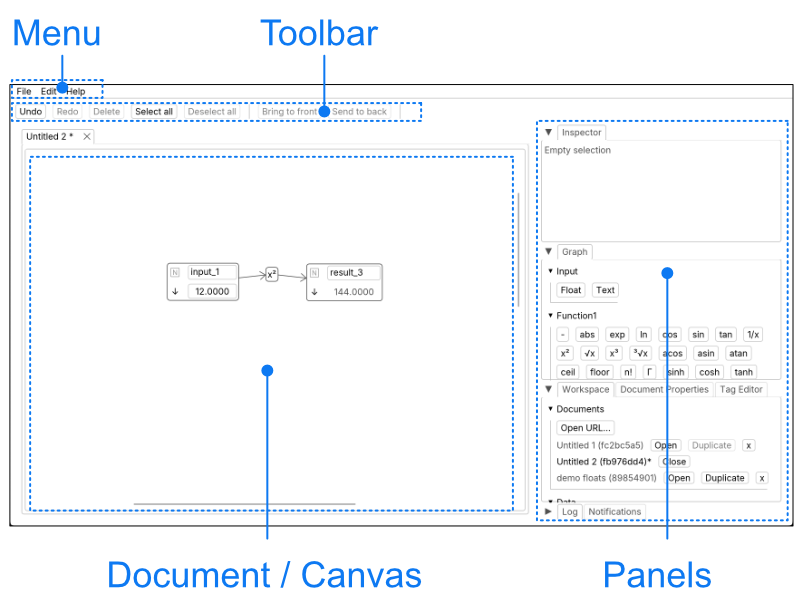
Panels
Panels can be reorganised by drag-and-dropping the tabs.
Selection
A selection can contain nodes and edges you can operate on, such as moving, deleting or connecting.
A selection can have a primary selection when multiple items are in the selection. You can differentiate them by the hue difference.
On mobile devices: to region-select, long-press on the canvas until you see a blue rectangle appear and shrink. The app runs on mobile devices (phones and tablets), but a bigger screen and a pointing device (mouse or trackpad) are desirable.
Inspector
The inspector will show details of the primary selection.
Chapter 1 - Arithmetic nodes
A node can be a value or an operation (like an arithmetic function or a SQL script).
A scalar is a basic value, as opposed to a table.
Values can be:
- scalar:
- just a singular value: a decimal number (“float”)
- a string (like “hello”) these have more limited use, and are mostly useful as SQL node input (see later)
- tables: a collection of columns, with a type per column
Transformations can be:
- scalar operations such as:
- function1’s: unary function like negation, absolute value
- function2’s: binary function like addition, multiplication
- table transformation,
Node name
A node has a name that is unique across the document - no 2 nodes can have the same name.
Node anatomy
To move a node on the canvas you can drag the handle which is on the top-left corner.
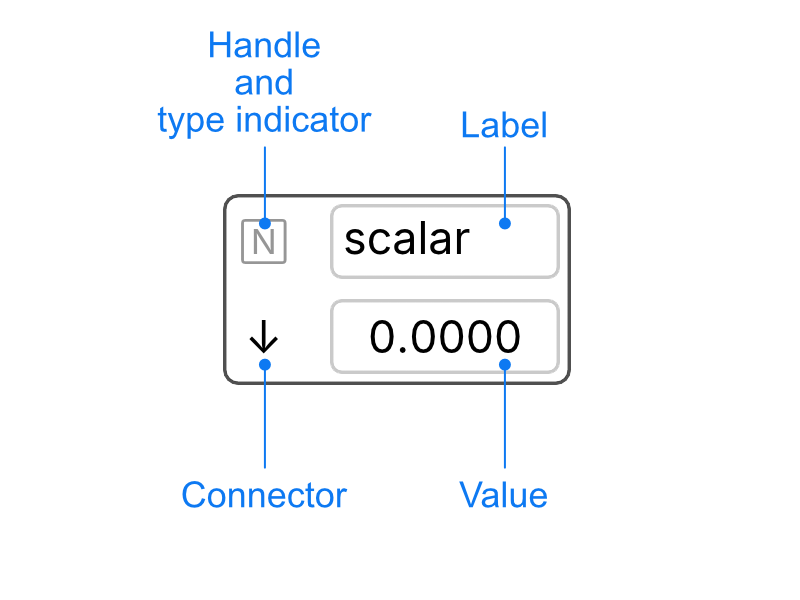
The type indicator show shows what type of node it is:
- N is for number (floats)
- T is for text (UTF-8)
Node label editing
A node’s label can be edited to rename the node.
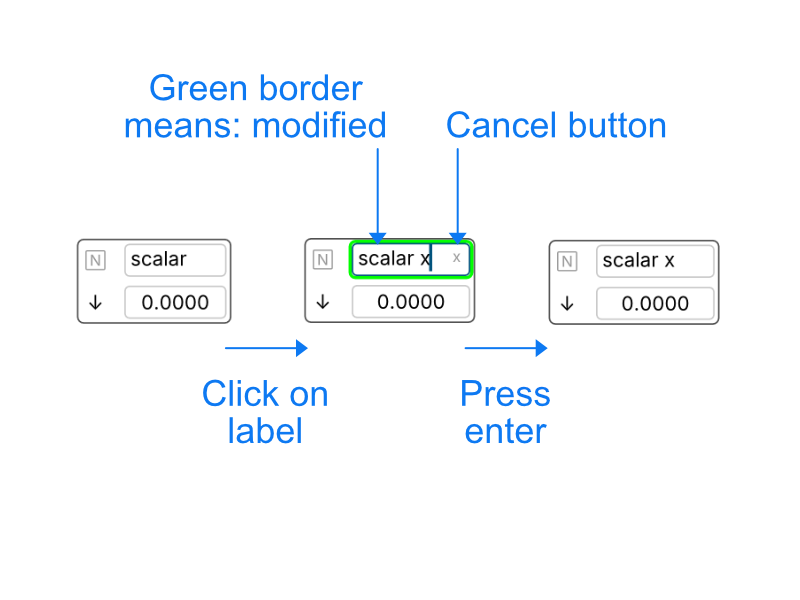
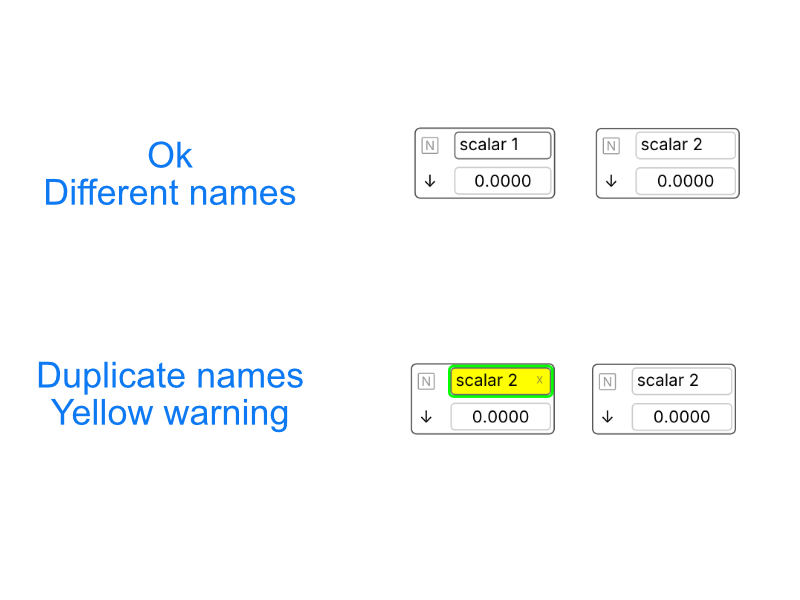
Node names are unique, there cannot be 2 nodes with the same name within a document.
If you try to rename a node with an existing name, the app will warn you by highlighting the name with a yellow background.
Scalar nodes
There are 2 types of scalar nodes:
- float: contains a float value: used in basic arithmetic and as input to SQL nodes.
- text: contains a string (mostly useful when connecting to a SQL node)
Moving nodes
To move nodes, use the handle of the node located in the top left corner of the widget. Function nodes can be dragged from anywhere.
Connecting nodes
Drag from the arrow pointing down (↓) in the node to the function node.
A function without all its inputs cannot be computed, hence the “error” output in the result node; once the function node has all its inputs the output will compute.
Disconnecting and reconnecting nodes
Nodes can be disconnect by deleting edges. To delete an edge, select it and press back space or the “delete” button in the toolbar.
Nodes can be reconnected, nodes can be connected multiple times.
Changing function nodes
Select a function node and click on another function in the panel. The result will update accordingly.
Chaining functions
To apply a function to a result node, select the result node and click on the button of the function.
Make sure the selection only contains 1 element for a function1.
“Function 1” and “Function 2” are respectively shorthand for “function of arity 1” and “function of arity 2”, a fancy way of saying how many arguments the function takes.
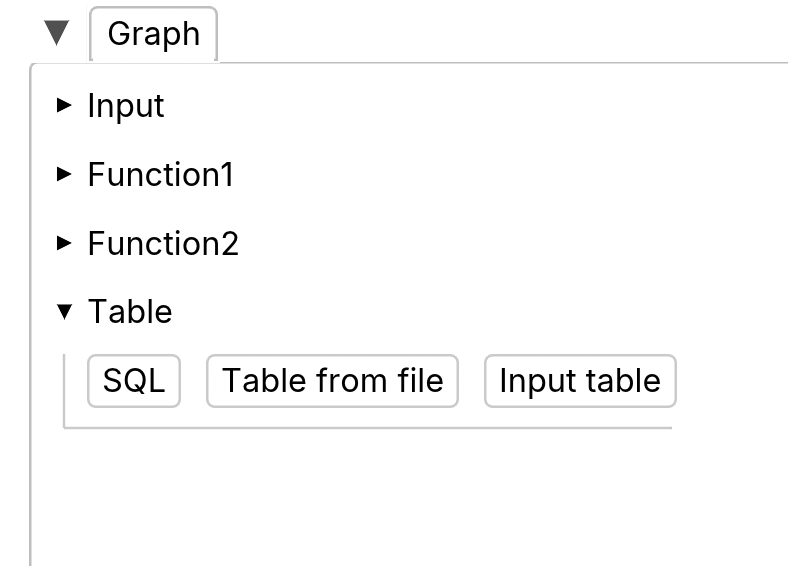
Chapter 2 - Table nodes
Table node and SQL nodes
Input table
Input table are for manual input tables. They are meant to input small tables by hand.
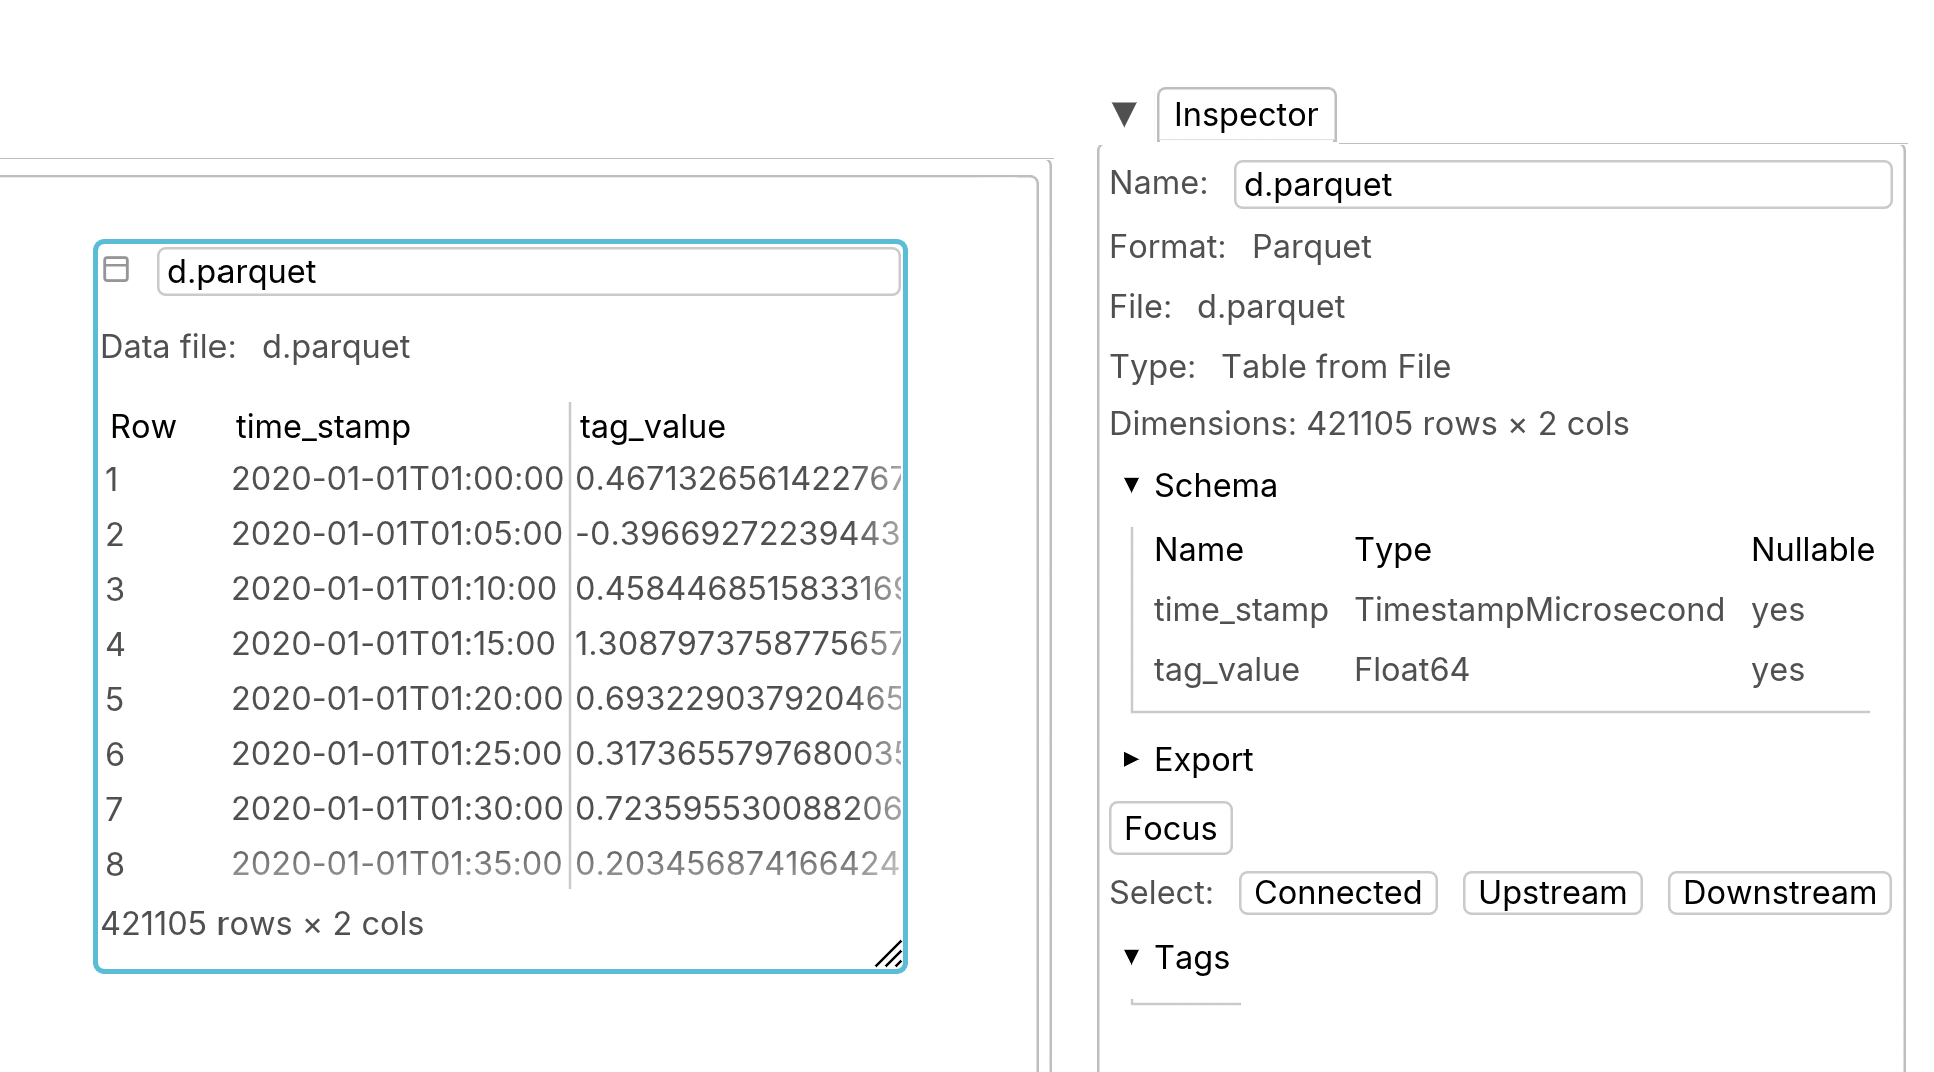
Table from file
This is the preferred way to do calculation on large tables. Parquet and CSV files are supported.
Parquet files are the preferred way to read data from files.
CSV tables are also supported, as a convenience.
Files are copied into the browser’s file system (OPFS).
SQL nodes
DAGraph uses DataFusion SQL, which is pretty close to Postgres SQL.
As it’s an OLAP tool, DAGraph SQL really only supports DQL (select queries).
Schema definition is done either by creating input tables or importing data from files.
DAGraph is functional, there are no side effect, SQL queries cannot do INSERT, UPDATE or DELETE.
Parameterized SQL queries
Queries with positional parameters, such as:
select
    $1 as number,
    $2 as text,
    $3 as inline
will be parsed and the widget will have “ports”. Ports can be connected, or values can be input.
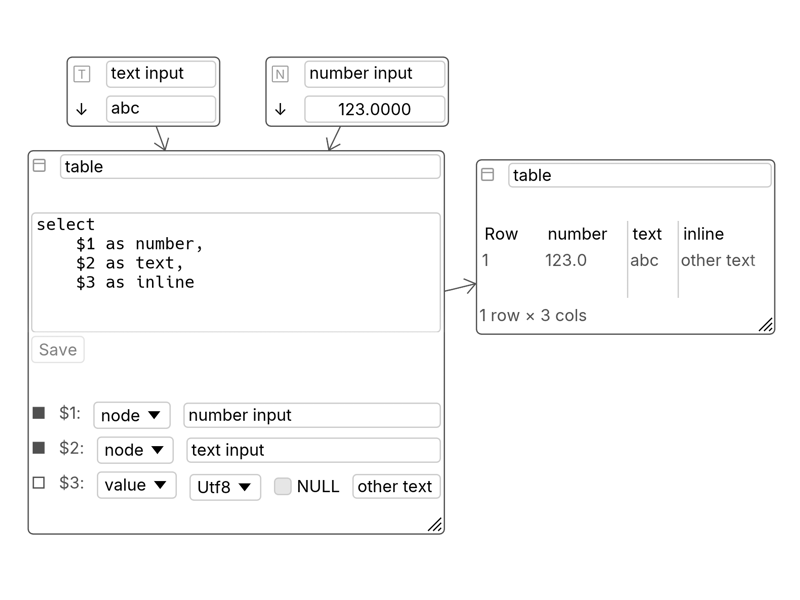
Connecting scalar nodes to SQL params
Drag and drop
Drag from the scalar node output to the params input.
Typing the input node name
You can also type in the node name, if you select “node”.
Removing edges from scalar nodes to SQL params
Select the edge and delete the edge.
Table output
SQL nodes have output table nodes.
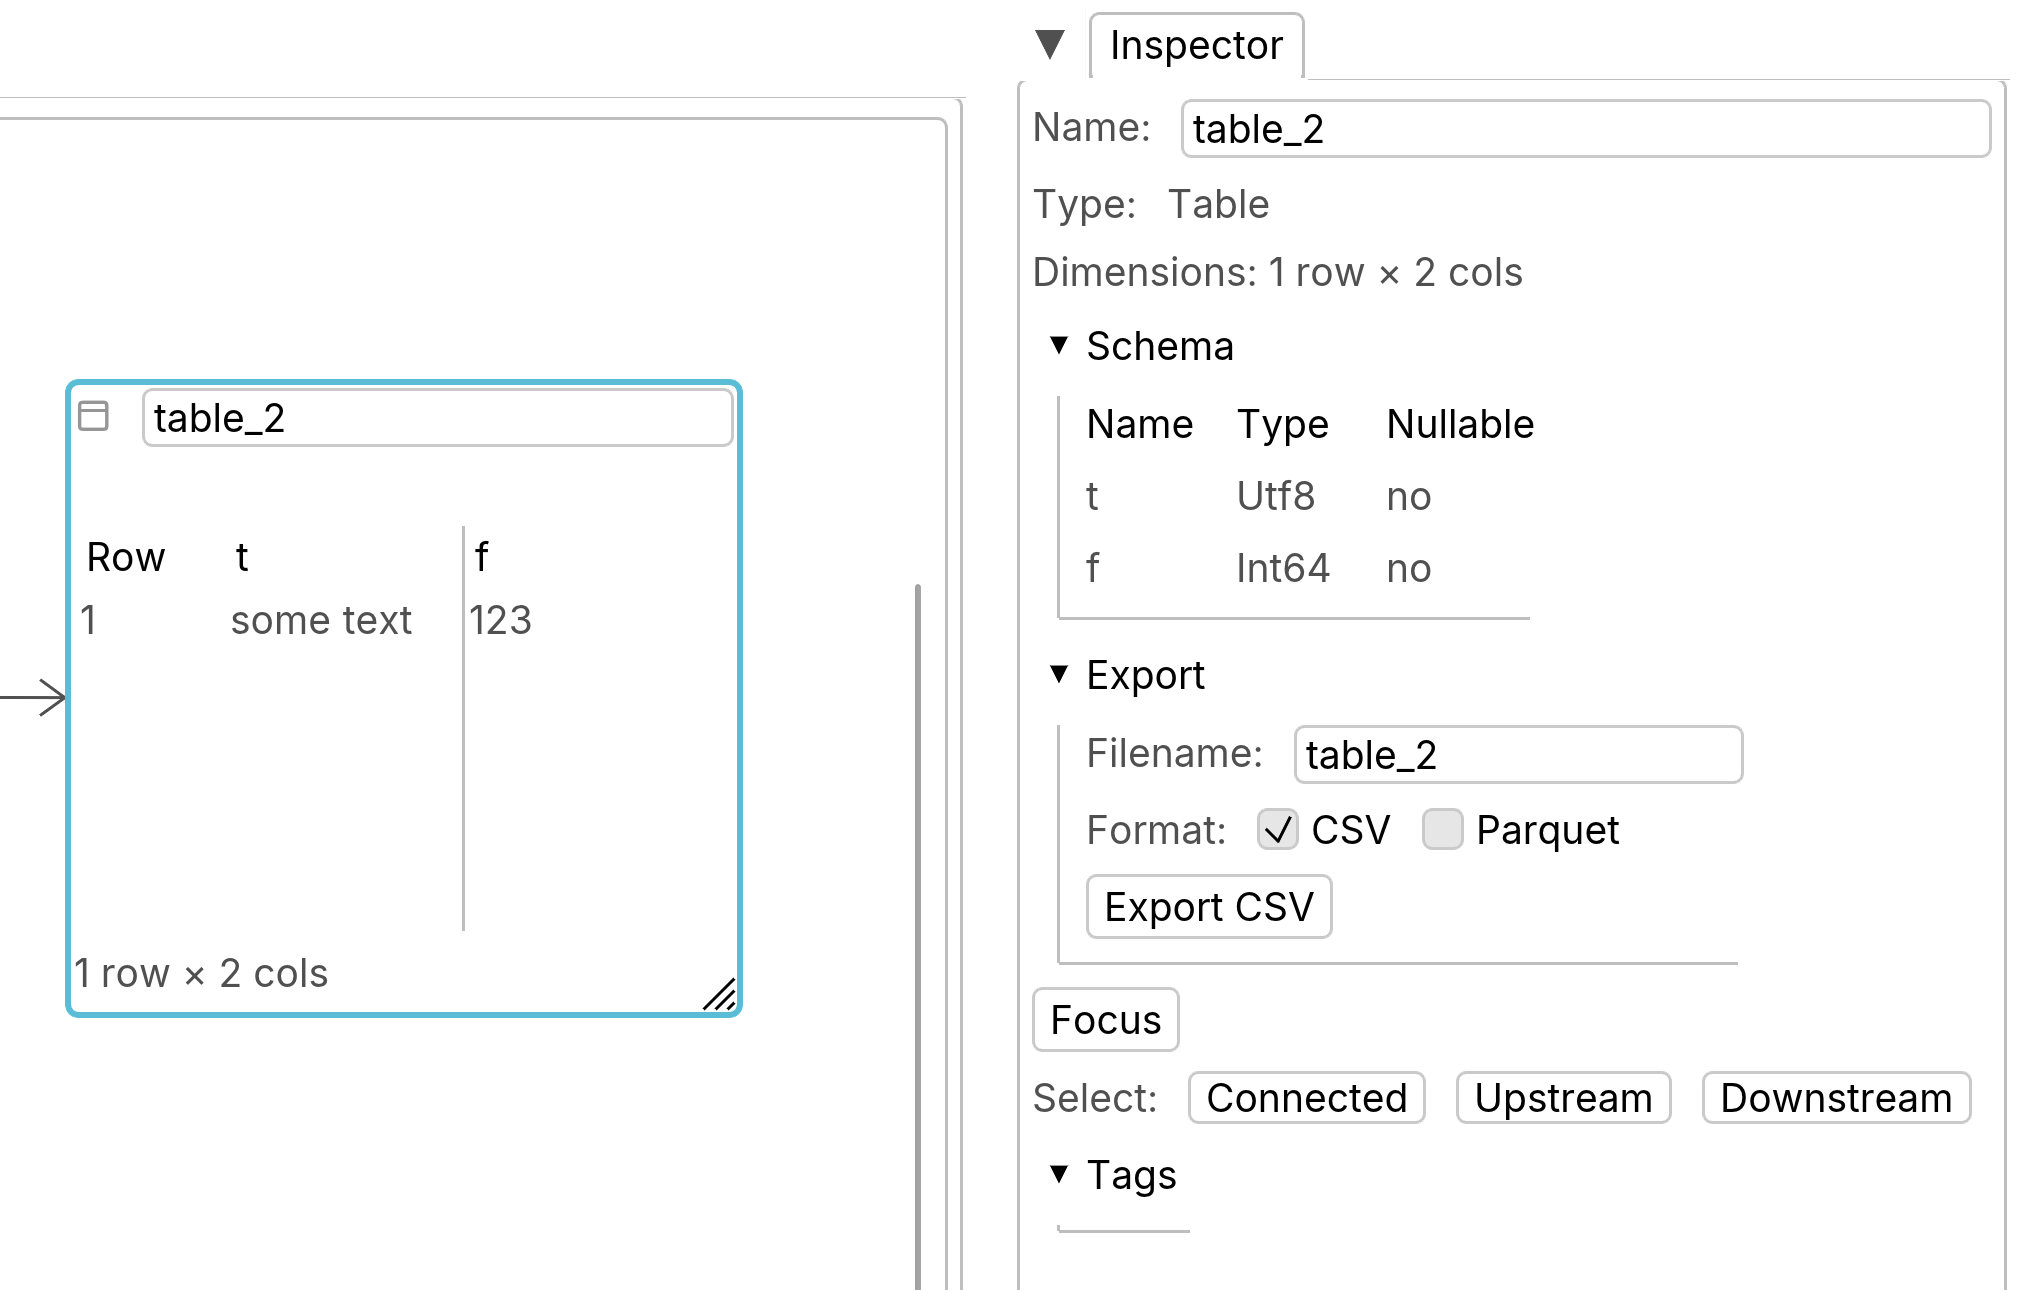
When a table node is selected, the inspector shows information about the table, such as its dimensions and schema. You can export the table as a Parquet file (preferred) or CSV.
Chapter 3 - Export
You can export the document from the workspace. You should export your document regularly, the workspace, as its name suggest is mainly for temporary storage while doing the work. In the browser the app uses OPFS, which comes with some limitation, and maybe purged by the system to reclaim space. The constraints are browser-dependent. To avoid any loss of data, export your documents regularly. Future version of DAGraph will be able to connect directly to version control system.
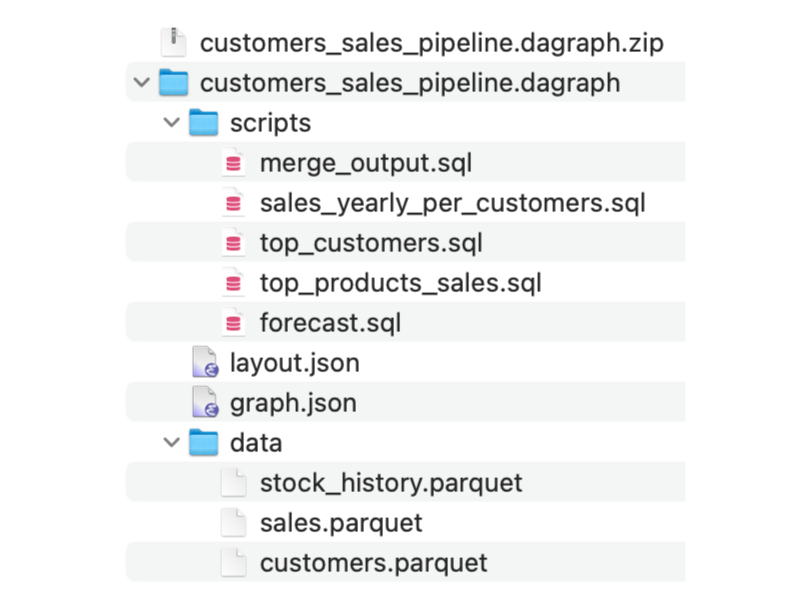
Archive
.dagraph files are actually zip bundles that contain:
- sql scripts (one file per node)
- graph description
- data files (optional)
It’s possible to see inside .dagraph files: on some systems, you just need to rename the file (e.g. foo.dagraph to foo.zip, or foo.dagraph.zip) and then unzip the archive.
The format is evolving, but the principle will remain the same.
Flat file
This format is deprecated and should not be used.
Misc
DAGraph website: https://dagraph.com