Introduction
DAGraph is a Data Analytics Graph or a Directed Acyclic Graph.
Caveat
As of the time of writing this book, DAGraph is still evolving quickly and still in early-access.
Some features may change, or be removed. Some features may move to the PRO tier (paid).
DAG - Directed Acyclic Graph
Directed acyclic graph. The data flows from the input to the output, there are no cycles.
The app will prevent you from creating cycles.
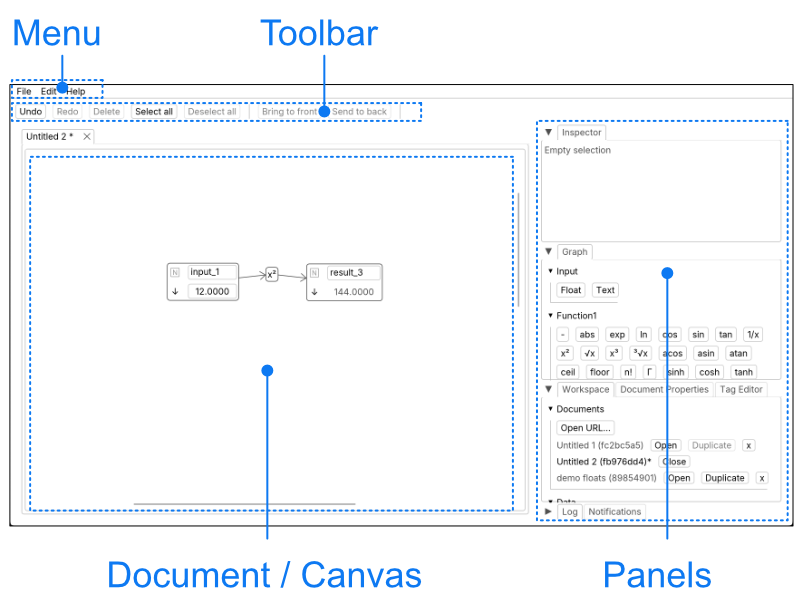
General UI overview
The window is split in 4 main parts:
- the menu (top bar)
- the tool bar (below the menu)
- the document / canvas view
- the panels
Panels
Panels can be reorganised by drag-and-dropping the tabs.
Selection
A selection can contain nodes and edges you can operate on, such as moving, deleting or connecting.
A selection can have a primary selection when multiple items are in the selection. You can differentiate them by the hue difference.
On mobile devices: to region-select, long-press on the canvas until you see a blue rectangle appear and shrink. The app runs on mobile devices (phones and tablets), but a bigger screen and a pointing device (mouse or trackpad) are desirable.
Inspector
The inspector will show details of the primary selection.